
Equiem's tenant experience platform offers a powerful suite of data and analytics tools. But to get the most out of them, you'll need to know what to look for.
The Most Important Property Management Analytics
When it comes to analytics, you should have two main goals. First and foremost, you'll be using data to build a detailed and accurate understanding of your user. But in addition to that, you'll also use analytics to ensure that your platform — and the way you're using it — is effective.
Think about it like this: analytics are the key to understanding your user... and the key to confirming that your understanding is accurate. When you truly know your users, that will inform your strategy. And you'll see the results of that strategy appear in the data as well.
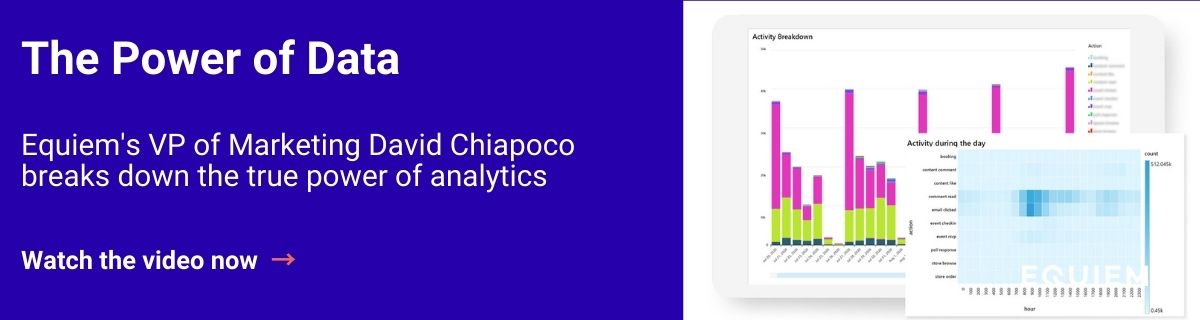 Discover the power of data with Equiem marketing VP David Chiapoco
Property management analytics start with tenant analytics
To understand the health of your property — or even portfolio — as a whole, you need to understand the users. How engaged are they? How do they interact with the building? When are they most active?
Knowing key data points such as these can help to paint an overall picture of tenancies. The more engaged users are, the more likely that the corresponding tenant will renew their lease when the time comes.
1. Visits per user
By monitoring the unique visits per user, you can get a sense of just how engaged your userbase actually is.
A higher VPU indicates a higher level of enthusiasm on the part of your users. Your users aren't just checking in on occasion — they're actively engaged with your platform. They check news posts and building information; they use the platform to take advantage of the amenities in your building.
And, of course, one of the best ways to increase your Visits Per User is to ensure that there is a loop of engaging content and capabilities on your platform. For example, you could highlight rotating specials in your retail precinct that can then be claimed via the tenant app.
Content is key to increasing your VPU. Make sure that your newsletters, notifications, and news items are all as exciting and engaging as they can be. Pay attention to what resonates with your user base and ensure that you are crafting subject lines with those issues in mind.
After all, your email newsletter is one of the most powerful tools available to encourage repeated engagement from your users.
2. Email and newsletter data
Newsletters are key to getting consistent engagement from your userbase. They're a great place to highlight new offerings, old favorites, news, upcoming events, and more. By ensuring that your newsletter is going out on a regular basis, you can keep the momentum up for all your other initiatives.
That's why it's so important to monitor the analytics of your regular email campaigns.
There are three main metrics to keep your eye on when it comes to newsletters: Open Rate, Click Through Rate, and Click to Open Rate.
To put it simply, these are the metrics that let you know how people are engaging with your emails. Open Rate tells you how many people are opening the email. Click Through Rate lets you know how many people from yout total subscriber base click on a link within the email. And Click to Open Rate is a combination of the two, describing what percentage of active email readers end up clicking a link.
These metrics show you just how effective your newsletter is. Not enough people opening your email? You might want to work on tightening up your subject lines. Nobody clicking through your links? It could be time to rethink the content you're including.
Remember, your newsletter can be a major boost to both digital and in-person engagement around your site. Make sure it's as potent as it can be!
3. Activity at time of day
At its most essential level, data analytics is about knowing your users. When everything is functioning perfectly, there should be a loop between data and design. You create content and functions that your users love using, then analyze the way they engage to make even more engaging content.
That's why Activity at Time of Day is such a powerful tool. If you know when your users are most likely to engage in certain ways, you also know how to optimize your platform and site to suit their habits and rhythms. And that means better results for the investor, and a better experience for users.
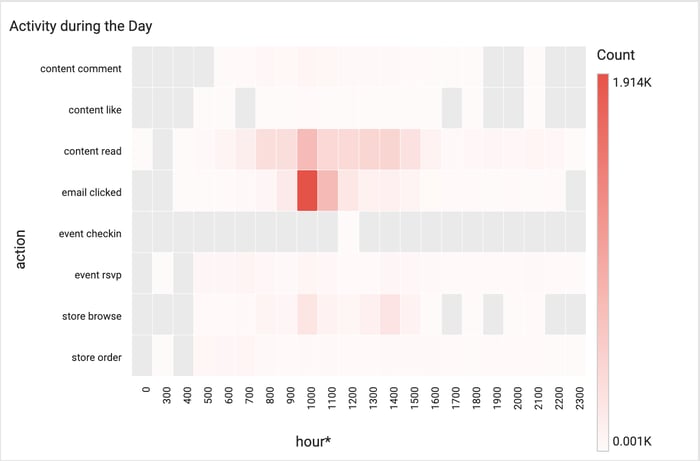 Monitoring the time your users engage can provide valuable insights and opportunities
Customizing your platform around the natural rhythms of your users will result in better returns. If you know when they're most likely to open and read a newsletter, you can schedule your newsletter accordingly to ensure its success. If you know when the afternoon coffee craving tends to hit, you can coordinate with your retailers to offer time-sensitive specials designed to maximize engagement.
A great tenant experience platform is symbiotic. It helps you understand your users which, in turn, helps you offer them a more satisfying, tailored experience. That's a loop that repeats forever.
And as it does, your results will get better and better.
Gain a deeper understanding of your users and boost the loyalty of your tenancies. Book a free demo today and take advantage of Equiem's detailed analytics.
Topics:
Engage


.jpg?width=461&height=400&name=Untitled%20presentation%20(1).jpg)