
When it comes to tenant retention, leasing teams can sometimes find they are operating with limited data and information about the tenants in their buildings — making it difficult to know what tenants want, think, and feel.
The right data can help you can help fill in your blanks, proactively build custom profiles of the tenants in your building, and suggest proactive retention strategies based on past behaviours and future predictions.
With these tenant profiles in hand, you can then create personalised re-engagement campaigns and offer first-class service, and provide to your leasing teams strategic intel for negotiations.
First, we capture tenant actions in one place
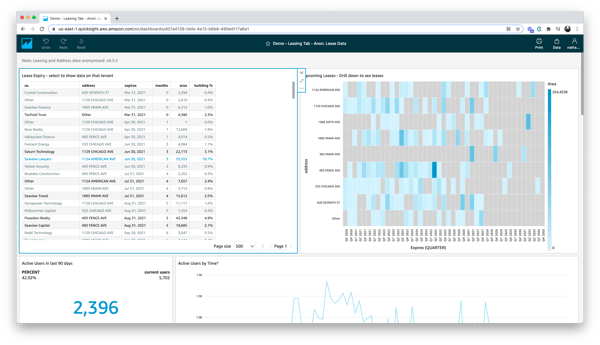
The dashboards collect and display a massive array of customer datapoints. Every time a customer uses an Equiem product, such as our tenant experience platform for web or mobile, that data is synthesized and presented to you in detailed feeds.
For instance, at a glance, you'll be able to see active usage, top read content, registrations and deactivations, poll responses, bookings, conversion rates, and more. Each of these feeds are sliceable by time and tenancy - so you can dive as deep into the behaviours of a specific tenancy as you need to.
Next, build tailored strategies
The question is: How do you build a tenant retention strategy with all the data you have?
It starts with the 'Lease Expiry' feed. Here you can see all of your tenancies in order of lease renewal date. A countdown deadline tracks the months remaining until the expiry of the lease. This way, you can easily dedicate resources and efforts to the largest, nearest term and/or most at-risk tenancies. This feed also shows you the physical area (and percentage of building area) occupied by this tenant.
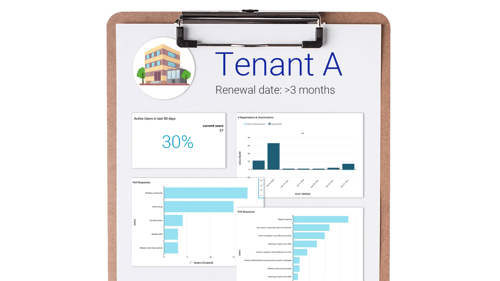
Here's an example of the kind of profile you could build (looking at the image above):
- Tenant A has an active usage rate of 30% in the last 90 days. That's below average, but it needs further qualification.
- We can see a very low rate of deactivations over time. So the users in Tenant A have arrived and stayed with the platform.
- Results from recent polls tell us users in Tenancy A are keen to return to the office and are missing the activations you hold. That explains the lower-than-average active usage rate, but is promising for when they do return.
- Poll results also suggest they need stringent cleaning policies in place before they'll come back.
From this information alone, you have a plan of attack in securing positive sentiment and goodwill from this tenant.
You can:
- Institute new cleaning policies around your building (in line with those expected from Tenant A)
- Then set up a dedicated content campaign just for Tenant A to let them know about your new cleaning policies, and track their responses, and
- Hold a special welcome-back VIP event just for this tenant (or a group of high-profile tenants) to welcome them specially back to the building.
Then, when the time comes to discuss renewals with Tenant A, you have an accurate profile and a compelling narrative demonstrating your commitment to personalised service.
Equiem's Leasing Dashboards help you to build rewarding long-term relationships with your tenants. To find out more, check out this video:
Topics:
Engage


.jpg?width=461&height=400&name=Untitled%20presentation%20(1).jpg)